
The minimal effective set is daily wellness, session RPE, and a session-level external load number, checked against 7-day and 28-day rolling averages. Collect wellness and sRPE every day, log external load at the end of each session, and review trends weekly rather than reacting to single-day swings. Interpretation works best against each athlete's own baseline, not a universal cutoff, since individual baselines outperform one-size-fits-all thresholds.
TL;DR:
- Use a morning survey with three questions and a 1 to 4 scale for sleep, soreness, and stress; it takes under a minute.
- When external load stays level while internal load rises, check sleep, stress, or illness before changing the training plan in response.
- Treat the acute to chronic workload ratio as a trend flag, not a risk cutoff; its use remains debated, and athlete baselines differ.
Table of Contents
- 1. Key metrics worth collecting every week
- 2. External vs internal load: why both numbers matter
- 3. A practical monitoring routine you can start this week
- 4. Reading the trends: baselines, ACWR, and when to step in
- 5. What the research says, and a sample week in practice
- 6. Benefits of automated data collection and integration
- 7. Real-time feedback and why it keeps athletes engaged
- 8. Functional fitness KPIs worth tracking over time
- 9. How historical data shapes long-term athlete development
- 10. Keep the system simple, consistent, and athlete-centered
- How VO2WOD fits into a monitoring routine without the manual work
- FAQ
- Sources
1. Key metrics worth collecting every week
Effective athlete effort tracking rests on three kinds of information, and each one answers a different question.
External load measures the work actually prescribed or completed: session duration, reps times load, GPS distance, power output, or jump counts. You can pull most of this from a session log, a barbell tracker, or a wearable summary without adding a single extra step for the athlete.
Internal load captures how the body responded to that work. Session RPE (rate of perceived exertion, reported after the session) is the cheapest and most widely used option. Session heart rate, heart rate recovery, and heart rate variability (HRV) add physiological detail, though HRV is best captured first thing in the morning rather than mid-session.
Wellness items round out the picture: sleep quality and quantity, muscle soreness, and mood or stress, usually gathered through a short morning survey.
- External load: duration, volume load, distance, power, or jump count logged per session.
- Internal load: session RPE every time, heart rate or HRV when the sport and budget allow it.
- Wellness: a 1-4 scale for sleep, soreness, and stress, answered each morning in under a minute.
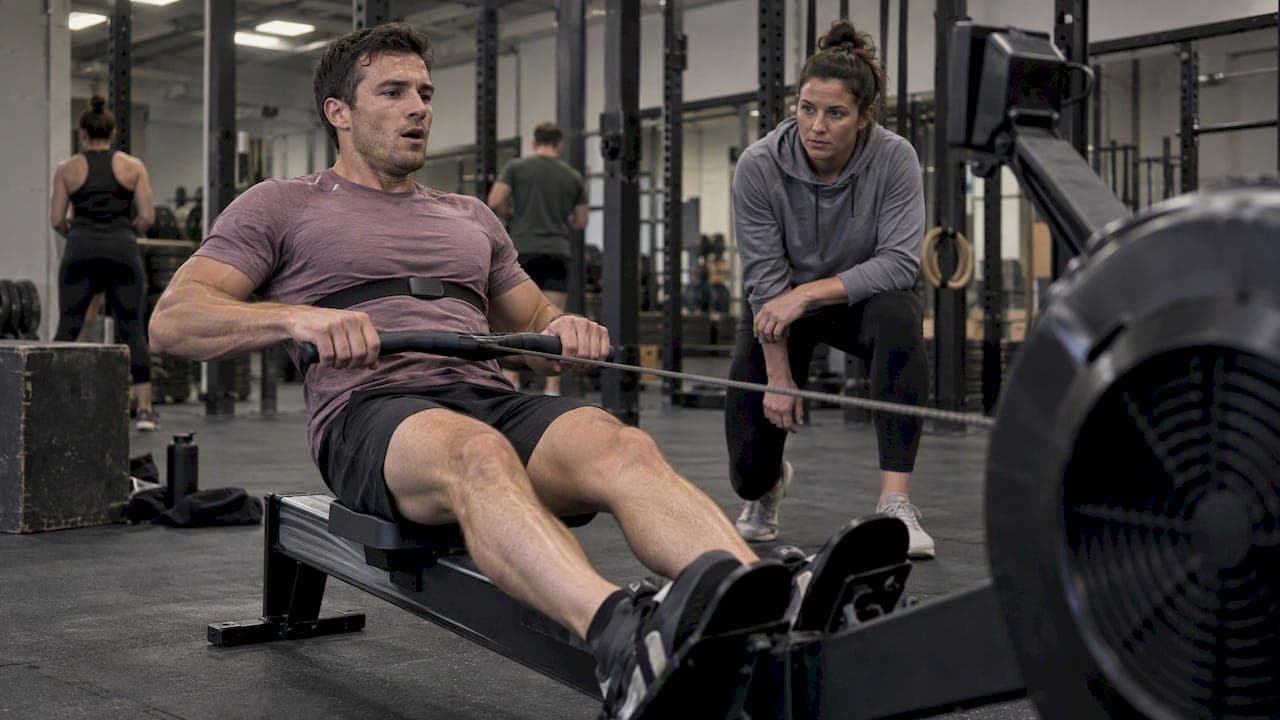
A chest strap reads heart rate more reliably during high-intensity intervals than a wrist-based optical sensor, which matters more for sports with rapid heart rate swings than for steady-state work. Many teams run this entirely on a shared spreadsheet; others use a lightweight app that timestamps entries automatically.
Pro Tip: Keep the daily survey to three questions or fewer. Compliance drops fast past that point, and a half-completed survey is worse than no survey at all.
2. External vs internal load: why both numbers matter
External load is the dose: the work a coach assigns and an athlete finishes, regardless of how it felt. Internal load is the response: what that dose cost the athlete physiologically or perceptually. Monitoring that combines both gives a fuller picture than either alone, because the same external load can produce very different internal responses depending on fatigue, sleep, or stress outside training.
A few pairings make this concrete:
- Running distance or high-speed running meters paired with heart rate and session RPE.
- Lifting volume (sets times reps times load) paired with velocity loss or perceived exertion.
- Jump count or power output paired with heart rate recovery between efforts.
When external load stays flat but internal load climbs, something outside the plan is driving fatigue. Plotting the two as a simple time series, or as a scatter plot of external against internal values, makes that divergence visible in a way a single number never does. Teams with more analytics capacity can go further with density-based session profiling, which has been shown to reveal differences between session types that single summary numbers miss.
3. A practical monitoring routine you can start this week
A workable routine needs almost no extra equipment, just consistent timing.
- Each morning, collect sleep hours, sleep quality, and soreness or stress on a quick 1-4 scale, with HRV as an optional add-on for athletes who already use a chest strap or ring.
- Fifteen to thirty minutes after each session, record session RPE along with duration and whatever external metric fits the sport.
- At the end of each week, total the 7-day external and internal loads and compare them against a rolling 28-day average.
- Flag anything beyond roughly one standard deviation, or a large percentage jump, for a closer look rather than an automatic response.
This sequence mirrors the monitoring cycle recommended in applied sports medicine guidance: external load, then internal load, then perceptual wellness, then readiness, reviewed together instead of in isolation.
A few implementation details decide whether this sticks. Get explicit athlete buy-in before asking for daily data, since forced compliance produces unreliable answers. Keep survey timing consistent, same time of day, same format, every time. Check for missing entries weekly rather than at the end of a month, when gaps are harder to explain. And keep the required fields to the minimum that still tells you something: three wellness questions and one RPE number beats a ten-item form nobody finishes.
Pro Tip: Build the weekly review into a recurring 10-minute slot, not an ad hoc task. Routines that depend on finding spare time disappear within a month.
4. Reading the trends: baselines, ACWR, and when to step in
Raw numbers mean little without a reference point. Build each athlete's own baseline from several weeks of data, then flag deviations using standard deviation or a smallest-worthwhile-change estimate rather than a fixed number that applies to everyone.
The acute-to-chronic workload ratio (ACWR), comparing a 7-day acute window to a 28-day chronic window, is a common way to spot sudden spikes. It is widely used but genuinely debated, and works better as a trend flag than as a hard risk cutoff.
A simple decision matrix helps translate numbers into action:
- External and internal load both rising together: expected adaptation, keep monitoring.
- External load flat but internal load rising: investigate sleep, stress, or illness outside training.
- External load dropping with internal load still high: consider easing the plan or building in recovery.
- Both dropping sharply at once: check for injury, illness, or a missed or incomplete monitoring day before assuming a training cause.
Color-coded trend charts, green for stable, amber for watch, red for review, make these calls faster to spot across a full roster than scanning a spreadsheet row by row.
5. What the research says, and a sample week in practice
Combining external load with internal load produces a clearer training picture than tracking either alone, a point repeated across applied sports science guidance.
Practical monitoring tools such as session RPE, short wellness questionnaires, and simple heart rate metrics balance feasibility with information value better than complex lab-based measures for most applied settings.
A sample week: daily wellness and sRPE logged every day, external load captured per session, and a Sunday review comparing the 7-day total against the 28-day average. If an athlete's 7-day internal load spikes notably above their rolling average while external load stays level, that is the signal to ask about sleep and stress before assuming the program is the problem, not after. Dashboards that calculate these rolling windows automatically, rather than requiring a manual spreadsheet formula, cut the time a coaching staff spends on this step to a few minutes a week.
6. Benefits of automated data collection and integration
Manual entry is the biggest reason monitoring programs die within a few weeks. Every extra step, typing in a heart rate reading, copying an RPE score from a sticky note, consolidating five athletes' spreadsheets into one, adds friction that eventually gets skipped.
Automated collection removes most of that friction. A heart rate strap or watch that syncs directly to a platform during class means the external and internal numbers exist the moment the session ends, with no transcription step and no chance of a misread number. Integration matters as much as automation: when wellness surveys, session data, and wearable feeds land in one system instead of three disconnected apps, a coach can see the full picture for an athlete in one screen instead of cross-referencing a notebook against a spreadsheet against an app.

The practical payoff shows up in time saved and in data quality. Staff spend less time on entry and more time on the decisions that entry was supposed to support. Fewer manual steps also mean fewer transcription errors, which matters when a single bad data point can throw off a 7-day rolling average for an entire squad. For gyms running group classes, this is less a convenience feature and more the difference between a monitoring program that survives its first month and one that quietly stops after week two.
7. Real-time feedback and why it keeps athletes engaged
Effort data is far more motivating when an athlete sees it while it still matters. A heart rate reading on a screen mid-workout, or a score that updates the moment a set finishes, gives immediate feedback that a post-session spreadsheet entry never can.
That immediacy changes behavior in the room. Athletes who can see their heart rate zone or their pace against a target tend to push through the final minute of an interval rather than coast, because the number is right there instead of buried in a report they will check tomorrow, if at all. The same principle applies to coaches: a live dashboard during a class lets a coach spot an athlete whose heart rate is climbing faster than usual and check in before the session ends, not after reviewing the data the next day.
Real-time feedback also supports the wellness side of monitoring, not just the session side. An athlete who gets quick confirmation that their morning survey registered, or sees a short note acknowledging a strong week, is more likely to keep filling it in. Engagement with monitoring tools tends to track engagement with the program itself: when the feedback loop is fast, the data collection habit sticks, and the habit is what actually makes a monitoring program useful over months rather than weeks.
8. Functional fitness KPIs worth tracking over time
Functional fitness programming mixes lifting, conditioning, and gymnastics-style movement in a single session, which means the useful key performance indicators look different from a single-sport training log.
Workout scores (time to completion, rounds plus reps, or total weight moved) are the most visible metric, and automatic scoring removes the need for an athlete or coach to calculate and record them by hand. Heart rate during class, especially average and peak heart rate relative to an athlete's own history, flags whether a session that looked identical on paper actually hit the same internal load. Personal records across core lifts and benchmark workouts show longer-term strength and capacity trends that a single class score cannot capture. Attendance and session frequency, tracked alongside effort data, show whether a drop in performance reflects fatigue or simply fewer sessions logged that month.
Platforms built specifically for this kind of training track these KPIs together rather than as separate reports: workout score, heart rate zones, and personal records all tied to the same athlete profile and the same timeline, so a coach reviewing one athlete's month sees the full pattern instead of four disconnected numbers.
9. How historical data shapes long-term athlete development
A single week of effort data tells you how an athlete is doing right now. Months of it tell you whether the program is working.
Historical records make it possible to see whether an athlete's heart rate at a given pace has improved over a season, whether their RPE for the same workout has dropped as fitness improved, or whether their personal records in core lifts have plateaued despite steady attendance. None of those patterns show up in a single session's numbers. They only emerge when a coach can pull up six months of data in one view instead of reconstructing it from old notebooks or scattered spreadsheet tabs.
That history also protects against overreacting to short-term noise, as explained in detail in Why Athletic Metrics Matter for High School Athletes. A rough week that looks alarming in isolation often reads as a normal dip once it is placed against a year of baseline data. Conversely, a gradual decline that would be invisible week to week becomes obvious once it is plotted against months of history, giving a coach the chance to adjust programming before a small problem becomes an injury or a dropout. Long-term data is also what makes individualized baselines possible in the first place: you need enough history to know what normal looks like for a specific athlete before you can flag what is not.
10. Keep the system simple, consistent, and athlete-centered
The biggest mistake in effort tracking is not using the wrong metric. It is collecting too many metrics and burning out the habit before it produces anything useful. A three-item daily survey an athlete actually fills in beats a ten-item one that gets abandoned after two weeks, every time.
Treat the specific metrics as adjustable. A sprinter's external load looks nothing like a powerlifter's, and a youth athlete's wellness thresholds should not mirror a masters athlete's. The framework, external load, internal load, and wellness, holds across sports; the specific numbers inside it should not.
— Marcus
How VO2WOD fits into a monitoring routine without the manual work
![CTA image placeholder]
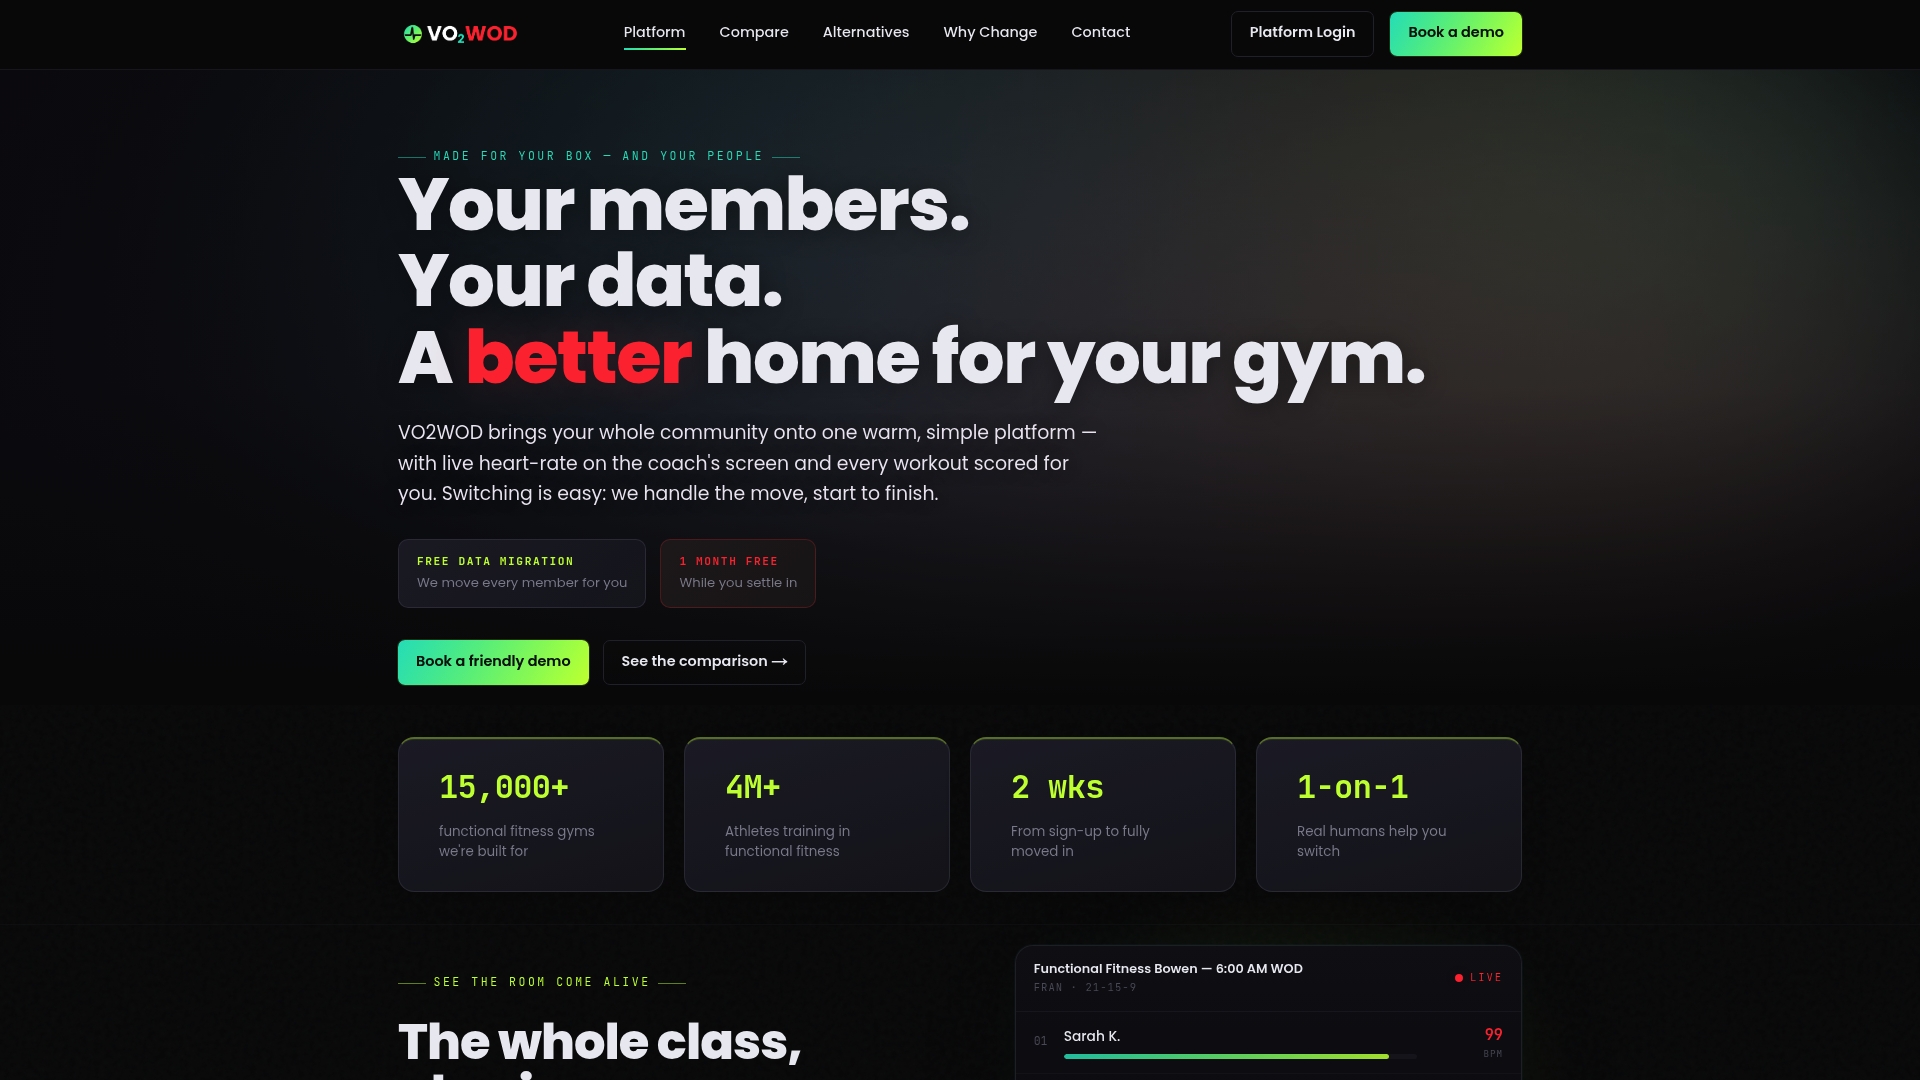
Running this routine by hand across a full roster is where most monitoring programs stall. VO2WOD was built to carry that load automatically for functional fitness gyms.
- Live in-class heart rate tracking that logs internal load the moment a session ends.
- Automatic workout scoring, so external load numbers never need manual entry.
- Wearable integration with various brands for athletes who already track at home.
- Free data migration and a complimentary first month for gyms switching from another system.
If your current setup is adding friction instead of removing it, compare options on the VO2WOD site or see how it stacks up for gyms considering a change at why switch to VO2WOD.
FAQ
What is the best indicator of athleticism?
No single metric defines athleticism, since it spans strength, speed, endurance, and movement quality at once. A combination of external load capacity (what an athlete can produce) and internal load efficiency (how economically their body handles that work) gives a far more complete picture than any one test.
What is the 4-2-1 rule for athletes?
This is not a standardized term in the sports science sources behind this article, and definitions vary by context. If you have seen it applied to a specific training structure, treat it as that program's own convention rather than a universal rule.
What do heart rate monitors and similar devices do for athletes?
Wearable devices like heart rate straps and GPS units capture internal and external load automatically during training, removing the need for manual logging. They feed real-time data to coaches, which supports faster decisions during a session and more accurate trend data afterward.
What are the 5 P's in sports?
This phrase is not a fixed, universally defined framework in athlete monitoring research, and its meaning shifts depending on the source. Coaches are better served building their monitoring plan around the better-documented external load, internal load, and wellness framework covered above.
How often should coaches check athlete monitoring trends?
Daily entries matter, but trend review works best on a weekly cycle, comparing 7-day totals against a 28-day rolling average. Checking more often than that tends to react to normal day-to-day noise rather than a meaningful pattern.
Sources
- Monitoring training effects in athletes: a multidimensional framework (PMC)
- Practical guide to athlete monitoring (British Journal of Sports Medicine)
- Capturing the complex relationship between internal and external training load (2D KDE paper)