
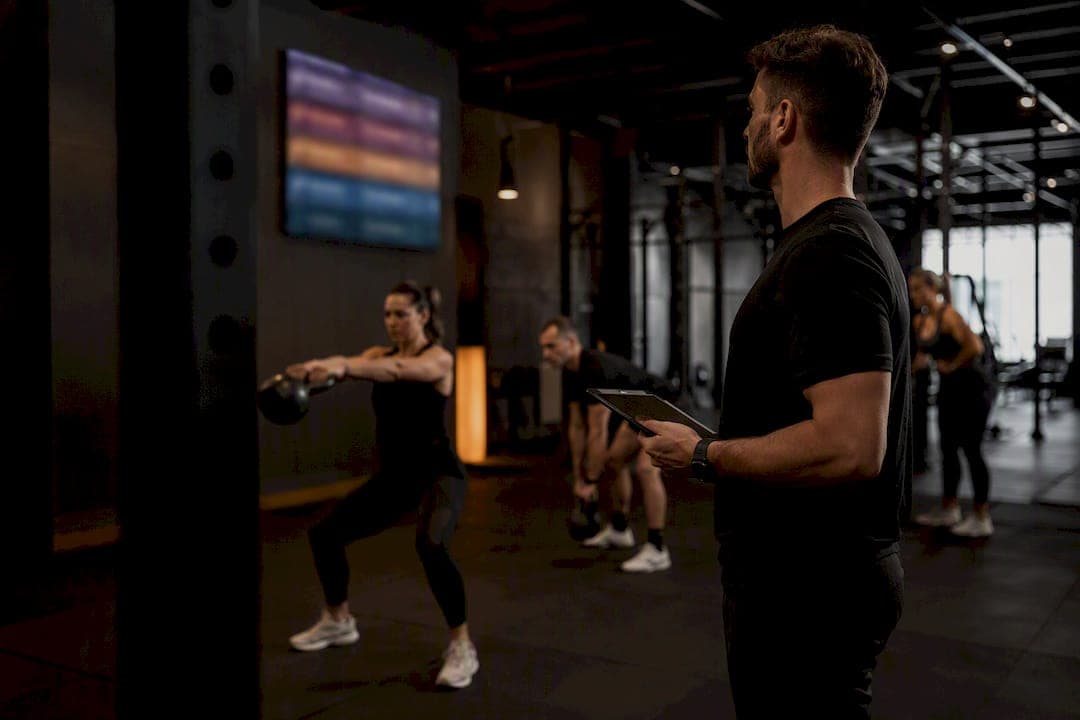
Six numbers separate a coach who guesses from one who knows: live heart-rate zones, an effort score per workout, time in zone during class, personal-record trendlines, attendance paired with effort history, and a weekly retention KPI. Track those with a platform like VO2WOD, and you're working from the same data set that studios using real-time heart-rate displays report as an 18 to 25% retention lift over classes running blind.
TL;DR:
- Effort scores provide a fair leaderboard system that reflects true workout intensity across different fitness levels, unlike raw output metrics.
- Real-time heart-rate zones, time-in-zone data, and effort tracking help coaches tailor cues and adjust programming based on actual member effort during classes.
- The success of biometric tracking depends on proper integration, manual fallback, and testing to address connectivity issues and ensure accurate data collection.
- Combining effort data with subjective feedback and coach notes offers a fuller picture of member engagement and coaching quality beyond heart-rate metrics.
- A low-risk 60-day pilot focusing on attendance and effort-score improvements can validate the impact of wearable technology before full gym implementation.
Table of Contents
- What Coach Performance Metrics Actually Measure
- How to Collect Reliable Coaching Data
- Turning Metrics Into Coaching Cues and Retention Wins
- Privacy and Consent for Biometric Tracking
- KPIs Beyond the Heart-Rate Monitor
- Setting Goals and Benchmarking Progress
- Reading the Data Without Misreading It
- Blending the Numbers With What You See in the Room
- Real Coaching Decisions Metrics Can Drive
- Where Coach Metrics Still Fall Short
- Author Perspective: What Operators Actually Gain From This Shift
- Try VO2WOD: Start a Pilot Without the Setup Headache
- Sources
- FAQ
What Coach Performance Metrics Actually Measure
"Coach performance metrics" gets used loosely in fitness software marketing, but for gym owners and coaches, it means something specific: the in-class data that shows how hard members worked, how they're progressing, and who's at risk of quitting. That's different from executive-coaching KPIs you'll find elsewhere online, which measure client outcomes for professional coaching relationships. In a functional-fitness box, the term points at heart-rate zones, workout scores, and attendance patterns, not leadership development.
The five heart-rate zones and how to coach them
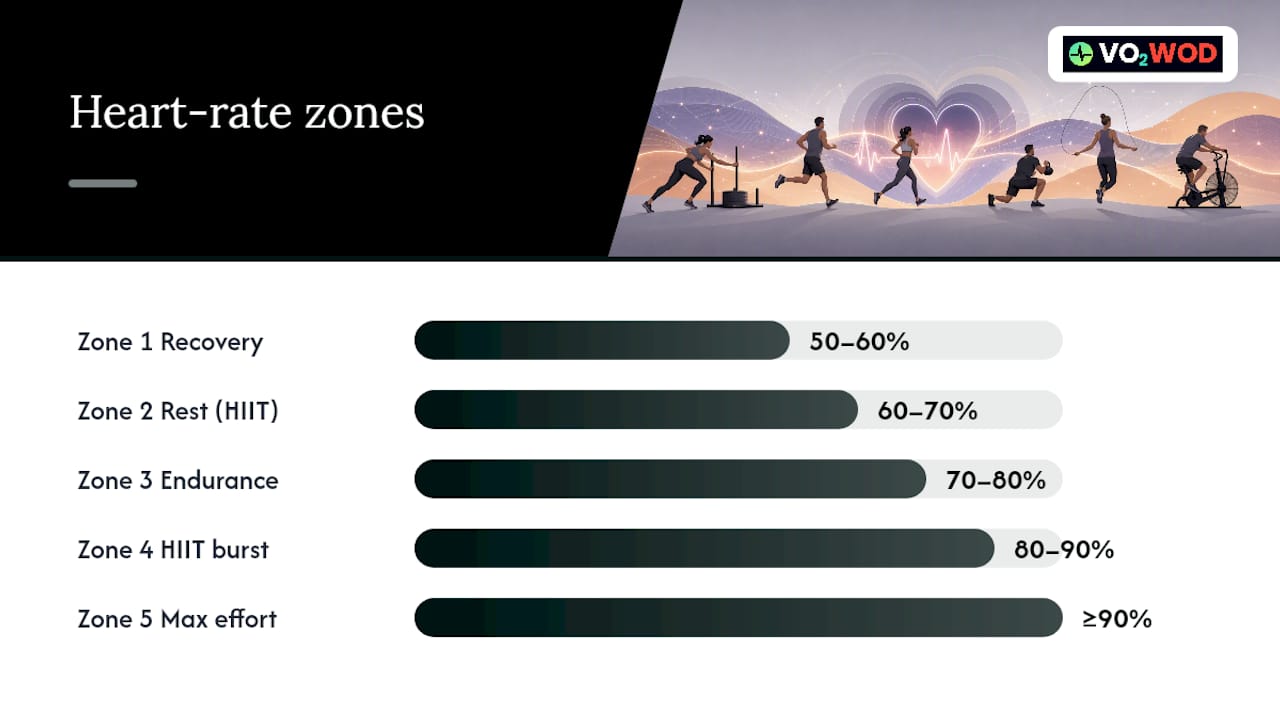
Every member's max heart rate divides into five zones, an industry-standard model running from Zone 1 (recovery, 50 to 60% of max) to Zone 5 (max effort, 90% and above). A HIIT class should push most members into Zone 4 or 5 for interval bursts, dropping to Zone 2 during rest. A conditioning or endurance class often targets sustained Zone 3, and if half the room is stuck in Zone 2 for 20 minutes, the workout isn't doing what it's supposed to.
Effort scores beat raw output on leaderboards
Relative effort scoring (points based on heart-rate zones and time, not raw reps or weight moved) levels the field between your fittest athlete and your newest member. That's what makes leaderboards feel fair instead of demoralizing.
Time in zone and time above threshold
These class-level numbers tell you whether the workout you programmed matches the workout that happened. If your target was 12 minutes above Zone 4 and the room averaged 6, either the intervals were too short, the rest was too long, or the class needs a harder progression.
PRs, trendlines, and attendance-effort pairing
Personal records and their rolling trendlines turn a single good day into a real progress conversation. Attendance without effort data hides a lot: a member coming four times a week at declining intensity is closer to quitting than one coming twice a week and hitting new zone highs.
Quick reference for coaches:
- Live HR zones: real-time in-class effort, used for verbal cues
- Effort score: fair leaderboard ranking regardless of fitness level
- Time in zone: whether the class hit its intended intensity target
- PR trendlines: individual progress over weeks and months
- Attendance + effort: early churn warning when frequency stays flat but effort drops
Statistic Callout: Gyms using real-time HR monitoring report 15 to 25% higher retention and can charge $5 to $15 more per HR-enabled class session.
How to Collect Reliable Coaching Data
Your data is only as good as what's feeding it, and most gyms end up pulling from four sources: wrist-worn smartwatches (Apple Watch, Garmin, Fitbit), chest straps and ANT+ sensors, and your class check-in and booking system. Wrist-based optical sensors are convenient but lag during fast direction changes, which matters during burpees or box jumps. Chest straps read electrical signals directly off the heart and stay accurate through explosive movement, which is why a lot of competitive boxes still hand them out at the front desk even when members own a smartwatch.
Integration happens through one of four patterns:
- Direct SDK/API connections pull data straight from Apple Health, Garmin Connect, or Fitbit's API into your scoring engine.
- Middleware and webhooks sit between the wearable and your platform, translating data formats so a Garmin reading and an Apple Watch reading land in the same dashboard field.
- Bluetooth relays broadcast live heart rate from strap to gym display without requiring the member to open an app.
- Hourly roster syncs keep your check-in and booking system talking to your scoring engine so attendance and effort data line up automatically.
Connectivity drops are the most common failure mode, usually when a class room has too many Bluetooth devices competing for bandwidth. Build in an auto-fallback to manual score entry, and spot-check a sample of readings weekly against a known device.
Pro Tip: Before rolling out to every class, run a two-week internal test with just your coaching staff wearing straps. You'll catch dead zones in the room and app-sync delays before a paying member ever notices.
A minimum viable pilot stack looks like this: roster sync, one wearable integration path, a wall-mounted display, a scoring engine, and a single coach dashboard. Everything past that is refinement.
Turning Metrics Into Coaching Cues and Retention Wins
Numbers on a screen don't change anything until a coach acts on them mid-class. If a member's heart rate sits in Zone 2 during work intervals, that's your cue to say "pick up the pace" or scale the movement up. If someone spikes into Zone 5 and stays there past their expected interval, that's a safety cutoff, not a leaderboard opportunity. The best coaches learn to glance at the display and adjust cueing in real time instead of waiting for the whiteboard debrief.
After class, the data keeps working. Automated summaries texted or app-pushed within minutes ("You hit a new 500m row PR today") turn a good workout into a shareable moment. Milestone celebrations, like a 50th class badge or a six-month effort-score streak, cost nothing to send once the trigger is built. Members whose effort scores have dropped for three straight sessions are exactly the people who need a personal check-in from a coach, not a generic email blast.
Program decisions should follow the same data. A study on HRV-guided high-intensity functional training found that athletes who trained based on heart-rate variability readiness scores hit the same fitness and composition gains as a fixed program, while spending roughly 13.6 fewer days at high intensity over 11 weeks. That's a real argument for building recovery-day flexibility into your programming instead of running everyone through the same hard week regardless of how their bodies are recovering.
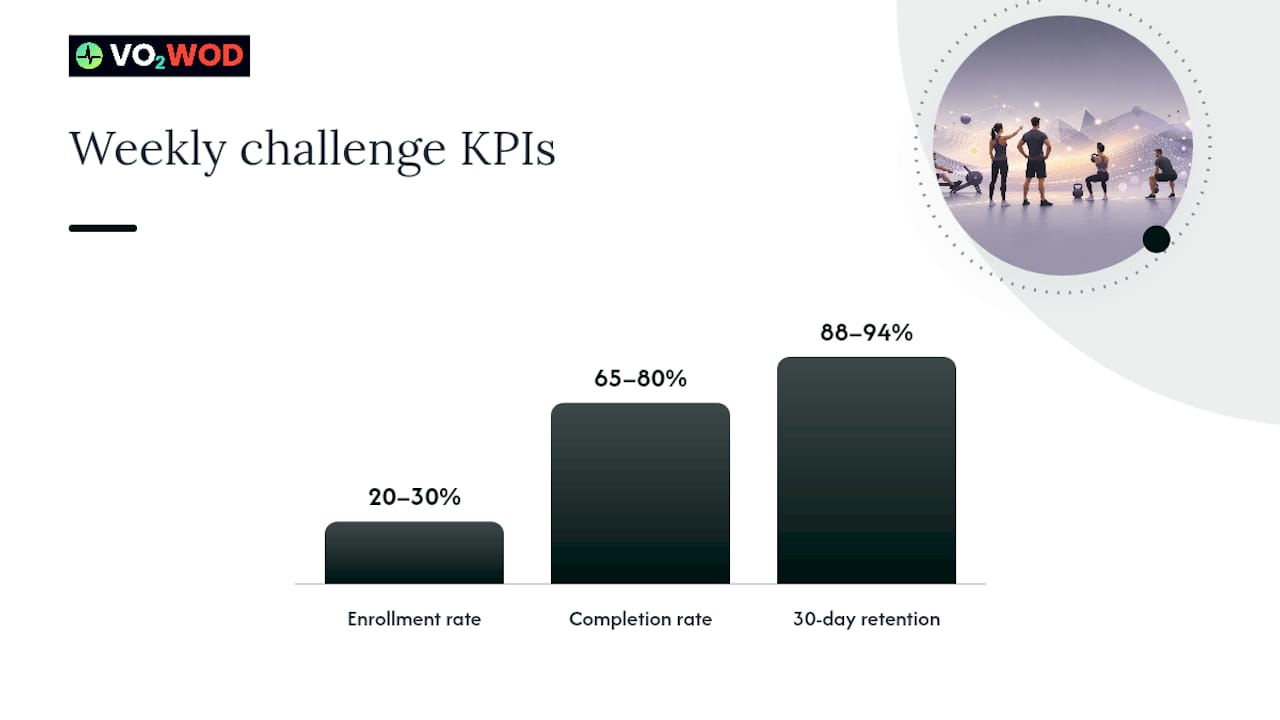
For weekly KPI tracking, watch four numbers: challenge enrollment rate, completion rate, effort-score trend by cohort, and 30-day retention after a challenge ends. Facilities using automated tracking see enrollment run 20 to 30% of active membership, completion between 65 and 80%, and post-challenge 30-day retention as high as 88 to 94%.
Statistic Callout: Automating challenge scoring cuts staff time from 25 to 40 hours per challenge down to 3 to 5 hours, and reduces scoring disputes by roughly 94% compared with manual tracking.
Privacy and Consent for Biometric Tracking
Heart-rate data is personal health information in most members' eyes, even when the law doesn't classify it that way for your facility. Require explicit opt-in consent before tracking anyone, with a plain-language notice explaining what's collected and who sees it. Store aggregated scores and zone summaries where you can, and restrict raw biometric streams to the coaching and admin accounts that actually need them.
Give members an easy opt-out that doesn't kick them out of classes, and set a retention policy that doesn't hoard data indefinitely. If you're considering anything beyond standard fitness tracking, like using heart-rate data for injury screening or making health claims to members, get legal counsel involved before you build the workflow.
KPIs Beyond the Heart-Rate Monitor
Biometric numbers tell you how hard someone worked. They don't tell you whether the coaching itself was good. That gap is where a lot of gyms stop measuring, and it's a mistake, because member retention tracks coaching quality just as closely as workout intensity.
Build a short participant feedback loop: a one-question post-class rating ("How was today's class, 1 to 5?") captures more signal than a quarterly survey nobody fills out. Track class-to-class consistency in that rating per coach, not just gym-wide, so you can spot a coach whose scores dip on programming days versus technique days.
Coaching-quality KPIs worth tracking alongside effort data include:
- Cueing accuracy: are coaches correcting form issues visible on video review or member reports?
- Class fill rate by coach: does attendance shift when a specific coach is on the schedule?
- New-member first-30-day retention by coach: which coaches turn first-timers into regulars?
- Injury or modification requests per class: rising numbers can flag programming that's outpacing the room's readiness.
None of these replace heart-rate and effort data. They sit next to it, filling in the human side that a wearable can't capture.
Setting Goals and Benchmarking Progress
Effort scores and PR trendlines only mean something against a target. Start with baseline weeks, three to four classes per member before you set any goal, so you're benchmarking against their actual starting point instead of a generic standard.
From there, set goals in two layers.
Benchmark on a rolling basis, not a single before-and-after snapshot. A four-week rolling average smooths out a bad night's sleep or a missed meal without hiding a real downward trend. Revisit goals every 90 days. Members plateau, life happens, and a goal set in January often needs adjusting by April regardless of how good your programming is.
The mistake most gyms make here is setting one goal type and ignoring the other. Individual-only goals miss the fact that your Tuesday 6 AM class is systematically under-hitting intensity targets. Cohort-only goals miss the member who's quietly losing motivation while the class average looks fine.
Reading the Data Without Misreading It
A dashboard full of numbers creates a false sense of precision, and that's the biggest trap in this entire category. Small sample sizes, three or four classes, produce trendlines that look meaningful and often aren't. Wait for at least eight to ten data points before drawing a conclusion about any individual member.
Watch for confounding variables before you credit or blame the metric itself. A member's effort score drops for two weeks, and it's tempting to flag them as disengaging. But check first: did they change wearables? Switch from a chest strap to a wrist sensor, which reads lower during explosive movement? Start a new medication that affects resting heart rate? The data is honest about what it measured, not about why.
Averages hide outliers that matter more than the average itself. A class average time-in-zone that looks perfect can mask half the room overshooting and half undershooting, canceling out into a number that tells you nothing useful. Look at distribution, not just the mean, when a number seems off.
Never present a single metric as a complete verdict on a member's engagement or a coach's performance. Effort score plus attendance plus a subjective class rating together tell a real story. Any one of them alone is a fragment.
Blending the Numbers With What You See in the Room
The gyms that get the most value out of coach performance metrics use them as a conversation starter, not a final answer. A coach who notices a member's effort score climbing but their mood flattening during warmup has information a dashboard will never generate. That observation deserves equal weight to the number.
Build a simple habit: before every one-on-one check-in, pull up the member's trendline and pair it with a genuine question. Sometimes it reveals a mismatch worth investigating, like a member pushing effort scores up through anxiety-driven overtraining rather than genuine progress.
Coaches should log qualitative notes right alongside quantitative ones. A short line after class, "struggled with overhead position today, watch shoulder mobility," turns into a pattern over eight weeks that no heart-rate monitor will ever surface. Pairing that kind of note with the member's zone data gives you a genuinely complete picture instead of two separate half-pictures.
This blended approach also protects you from the accuracy limits of any single device. A wrist sensor might misread during a rowing sprint, but a coach standing three feet away watching the member's face and breathing knows immediately whether that "low" reading is real.
Real Coaching Decisions Metrics Can Drive
The value of this data shows up in specific decisions, not abstract dashboards. A coach reviewing time-in-zone data across four weeks of the same conditioning class notices the room consistently undershoots the Zone 4 target during the second interval block. The fix isn't more motivation; it's shortening the rest period by 15 seconds, which the next four weeks of data confirm actually closes the gap.
A member's PR trendline flatlines for six weeks despite consistent attendance. Rather than assuming a plateau, the coach cross-references effort scores and finds they've quietly dropped from averaging Zone 4 to averaging Zone 3. A conversation reveals a new work schedule cutting into sleep. The programming didn't fail; the recovery did, and the fix is a temporary deload, not a harder push.
Attendance data paired with effort scores flags a member attending four times weekly with steadily declining effort. That combination, frequent but fading, is a stronger churn signal than skipped classes alone, and it gives the front desk a specific reason to reach out before a cancellation request ever comes in.
Challenge participation data can reshape programming decisions too. If effort-based scoring during a monthly challenge shows deconditioned members scoring competitively against advanced athletes, that's validation the scoring model is doing its job of making challenges inclusive rather than a leaderboard only the fittest five people ever win.
Where Coach Metrics Still Fall Short
No metric system is complete, and pretending otherwise sets up bad decisions. Wearable accuracy remains inconsistent across skin tone, movement type, and device brand, particularly for optical wrist sensors during rapid movement. That's a real limitation, not a minor footnote, and it means any single reading deserves some skepticism until a pattern confirms it.
Member compliance is the second wall every gym hits. Not everyone owns a wearable, and not everyone who owns one wears it consistently. A gym that only measures members with devices ends up with a data set that skews toward the already-engaged, missing the exact members most at risk of quitting quietly.
Coaching quality itself resists quantification. Two coaches can produce identical effort-score averages in their classes while delivering wildly different member experiences, one through genuine connection and skillful cueing, the other through relentless intensity that burns members out within three months. Effort data alone won't catch that difference until retention numbers reveal it, and by then you've lost members you might have kept.
The fix for all three limitations is the same: treat metrics as one strong input among several, keep a manual fallback and spot-check process running, and never let a dashboard replace a coach's direct judgment about a room full of actual people.
Author Perspective: What Operators Actually Gain From This Shift
The biggest change gyms report after adding real-time metrics isn't the technology. It's that coaching cues get sharper, because a coach isn't guessing who's coasting and who's maxed out. Challenge engagement tends to rise once scoring feels fair, and milestone messages that used to take a staff member an evening to compile now trigger automatically.
This platform builds around exactly that gap: real-time heart-rate and effort monitoring, automatic workout scoring, and milestone messaging that runs without manual entry. Gyms switching over get free data migration and one month of complimentary service, with a dedicated team handling the transition. If you're comparing platforms, VO2WOD's feature breakdown against other gym-management options is worth a look before you commit to a vendor.
The honest caveat: no platform fixes bad coaching. It just gives good coaching better information to work with.
— Marcus
Try VO2WOD: Start a Pilot Without the Setup Headache
This software gives gym owners something most platforms make you build piece by piece: real-time heart-rate monitoring, automatic workout scoring, and roster sync that keeps attendance and effort data lined up automatically, all in one system instead of three stitched-together tools.
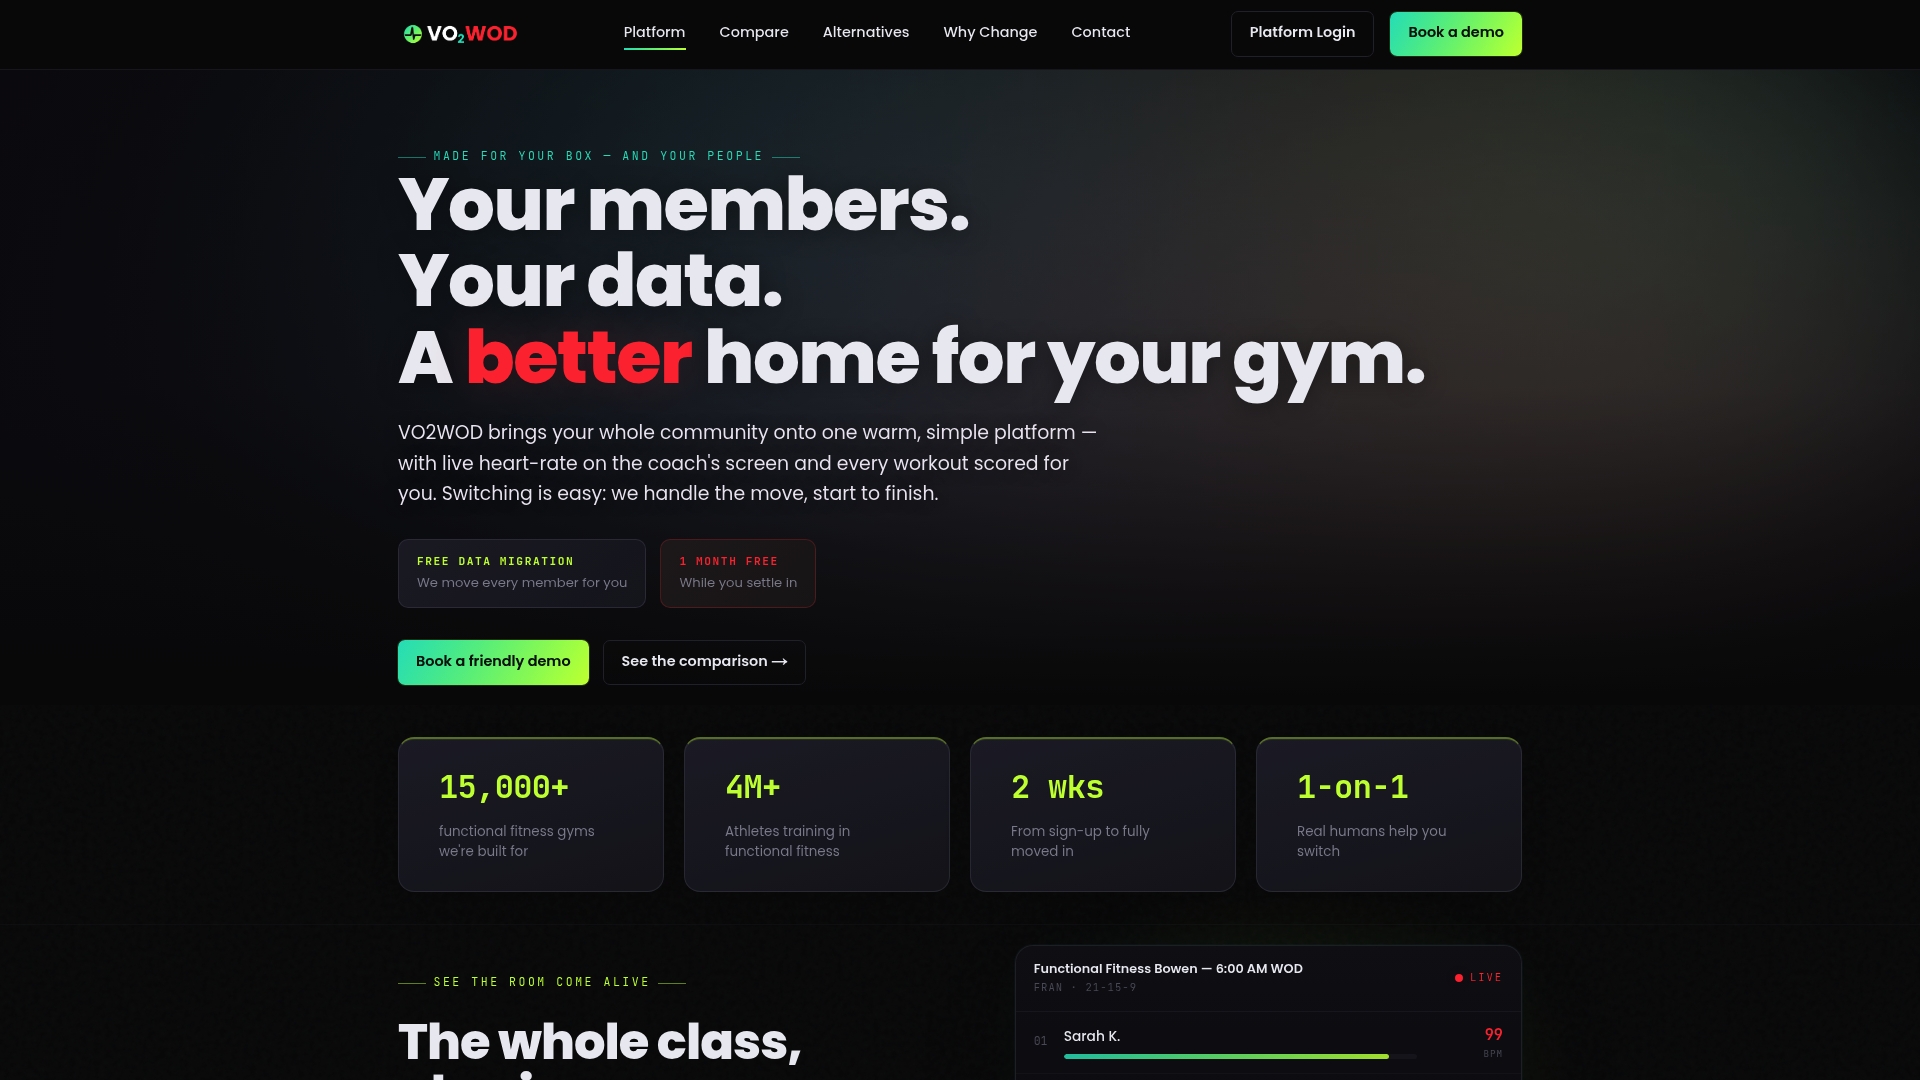
New gyms switching over get free data migration and one month of complimentary service, with support walking through setup instead of leaving you to figure out API keys alone. If you want to test the waters before a full rollout, the research on wearable pilots backs a specific approach: pick one class format, run it opt-in for 60 days, and measure attendance and effort-score lift before expanding gym-wide. That's a realistic, low-risk way to see whether live metrics change how your members train and how long they stay.
Check out VO2WOD's platform to see how the setup fits your class schedule, or compare it directly against what you're running now on the alternatives page before you switch.
Sources
- Wearable integration for gyms: heart rate tracking, leaderboards & partner devices - 2025 Guide
- Best heart rate monitoring systems for fitness studios in 2026 | StudioStackTools
FAQ
What Equipment Do I Need to Track Coach Performance Metrics?
At minimum, you need a roster sync between your booking system and a scoring platform, plus wearable integration covering Apple Watch, Garmin, or Fitbit, and a display for the room.
How Accurate Are Wrist-Worn Heart-Rate Sensors During Class?
Optical wrist sensors lag during explosive or rapid-direction movements, so chest straps and ANT+ sensors stay more reliable for HIIT-style classes with frequent movement changes.
Do Members Have to Opt In to Heart-Rate Tracking?
Yes. Biometric tracking should always run on explicit opt-in consent with a clear privacy notice, and members need a straightforward way to opt out at any time.
How Long Should a Metrics Pilot Run Before Rolling Out Gym-Wide?
A 60-day pilot in a single class format, measuring attendance and effort-score lift, gives you enough data to decide whether to expand, based on wearable-integration research.
Can VO2WOD Help With the Technical Setup?
Yes. This software includes free data migration and one month of complimentary service, with support assisting through the entire transition.