

Retention rate, average revenue per member, customer acquisition cost, trial-to-member conversion, class utilization, and monthly recurring revenue are the six gym KPIs that determine whether your gym makes money or slowly bleeds it. Track those six weekly and you catch problems while they're still cheap to fix. Everything else on your dashboard, from social engagement to app downloads, is secondary until these six are solid. The formulas and benchmark ranges below tell you exactly how to calculate each one and what "good" actually looks like in 2026.
TL;DR:
- Maintaining a retention rate above two-thirds and keeping trial-to-member conversion above 25% are essential for sustainable gym growth.
- Tracking churn accurately requires distinguishing voluntary cancellations from failed payments to avoid inflating attrition figures.
- Monitoring average revenue per member and monthly recurring revenue helps assess income stability and the effectiveness of add-on strategies.
- Focusing on lead response time and no-show rates can significantly improve conversion rates and overall marketing ROI.
- Regularly reviewing these core KPIs weekly, monthly, and quarterly ensures timely interventions to improve retention, revenue, and operational efficiency.
Table of Contents
- The Core Gym KPIs Every Owner Should Calculate
- Where to Find the Data and How to Avoid Common Tracking Mistakes
- What Good Actually Looks Like: Benchmarks You Can Trust
- Which KPIs to Check Weekly, Monthly, and Quarterly
- Applied Example: Turning Sensor Data Into Retention Signals
- Fix Retention Before You Chase More Leads
- How Vo2wod Turns These KPIs Into Daily Decisions
- Authoritative Benchmark Reports and Analyses
- Sources
- FAQ
The Core Gym KPIs Every Owner Should Calculate
Most gym owners track something. Few track the right thing correctly, and fewer still know which number they're chasing. Here's how to calculate the metrics that actually move your bottom line.
Retention rate measures the percentage of members who stay over a defined window, usually 12 months. The formula: (members at end of period minus new members acquired during the period) divided by members at start of period, times 100. Run it monthly too, since annual numbers hide seasonal cliffs. Split voluntary cancellations (member chose to leave) from involuntary ones (a card declined and nobody followed up) before you report a final figure. Lumping them together makes your gym look worse than it is and hides a fixable operational problem.
Churn and Length of Engagement (LEG) are retention's mirror image. Churn is simply 1 minus your retention rate. LEG measures the average number of months a member stays before leaving, calculated by dividing 1 by your monthly churn rate. LEG matters because it converts an abstract percentage into a number you can plan revenue around.
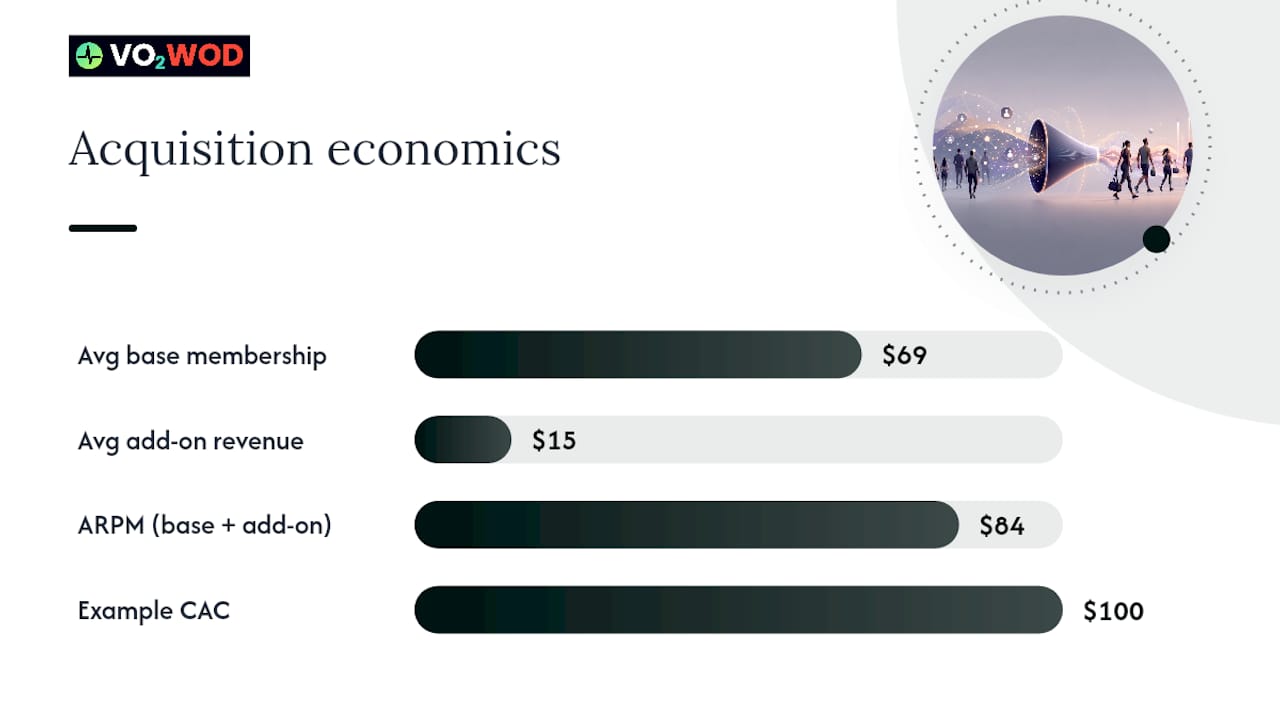
Average revenue per member (ARPM) and Monthly Recurring Revenue (MRR) tell you how much each member is worth and how predictable your income is. ARPM is total monthly membership and add-on revenue divided by active paying members. MRR is the sum of all recurring subscription revenue, excluding one-time purchases like retail or a single class pack. With the average US gym membership sitting near $69 a month, a gym adding $15 in average add-on revenue per member is already outperforming a competitor charging the same base rate with no attach strategy.
Customer acquisition cost (CAC) and trial-to-member conversion show whether your marketing spend is actually working. CAC is total sales and marketing spend divided by new members acquired in that period. Conversion is new members divided by total trial signups or leads, times 100. If you spend $2,000 on ads and close 20 new members, your CAC is $100. Compare that against your ARPM and LEG to see how many months it takes to recoup the acquisition cost.
Utilization, average class attendance (ACA), and visit frequency measure whether your physical space and staff are earning their keep. Utilization is bookings divided by total class capacity. ACA is total monthly attendance divided by number of classes held. Visit frequency tracks how often the average member checks in per week, a leading indicator of who's about to cancel.
Secondary sales and personal training (PT) attach rate round out the picture. This is the percentage of members who buy something beyond base membership, PT packages, supplements, apparel. Attach rate directly lifts lifetime value (LTV) and margin, since incremental sales to an existing member cost almost nothing to generate compared to acquiring a new one.
- Retention rate: (ending members − new members) ÷ starting members × 100
- Churn: 1 − retention rate
- ARPM: total monthly revenue ÷ active paying members
- CAC: total acquisition spend ÷ new members acquired
- Conversion: new members ÷ total leads or trials × 100
Where to Find the Data and How to Avoid Common Tracking Mistakes
Every one of these metrics lives somewhere you're probably already logging data. The trick is pulling it consistently.
- Retention and churn come from your billing or membership management system, cross-referenced against your access control logs to confirm a "member" is actually walking in.
- ARPM and MRR pull from your point-of-sale and billing system, summing recurring charges and add-on purchases in a single spreadsheet column, then dividing by active member count.
- CAC and conversion come from your CRM's lead table, matched against new-member signups in your billing system for the same date range.
- Utilization and ACA come from your class scheduling software, comparing booked spots against total class capacity for each session.
The most common measurement error is counting a failed payment as a voluntary cancellation, which inflates your churn number and hides a solvable billing problem. A close second is mixing "active" members (those who show up) with "paying" members (those who're billed) as if they're the same population. A third is double-counting revenue when a member upgrades mid-month, recording both the old and new charge instead of the net change.
Pro Tip: Build one dashboard tab that shows this week's lead response time, trial no-shows, and class fill rate, and a second tab for the trailing 30-day view of retention, ARPM, and MRR trend. Two tabs, checked on two different schedules, beats one cluttered spreadsheet nobody opens.
What Good Actually Looks Like: Benchmarks You Can Trust
Industry-wide annual retention now sits at about two-thirds, according to the Health & Fitness Association's 2025 benchmarking report, which surveyed many companies and facilities. That number replaces the outdated 71.4% figure many vendor blogs still cite from 2015, and using stale benchmarks means comparing your gym against a market that no longer exists.
Net profit margins for gyms typically run within a moderate range, with a median around the high teens percentage, according to BizMetricsHQ's industry analysis. On $1.2 million in annual revenue, that translates to modeled profit spanning a broad range, reflecting differences in payroll and occupancy costs.
Trial-to-member conversion for well-run studios typically ranges from about one-quarter to one-third, per the same industry benchmarking analysis. The gap between top and bottom performers usually comes down to how fast staff respond to a new lead and how many trial visitors actually show up.
Use the HFA number as your floor, not your ceiling. Microgyms and small strength and conditioning facilities should track LEG instead, since a 30-month average engagement length tells a clearer story than a bare percentage when your member count is small enough that one or two cancellations swing the whole rate.
Which KPIs to Check Weekly, Monthly, and Quarterly
Not every metric deserves the same attention. Checking retention daily is wasted effort; ignoring lead response time for a month is a slow leak.
- Weekly: lead response time, trial no-show rate, class fill rate, and MRR trend line.
- Monthly: retention and churn, ARPM, CAC and payback period, secondary revenue penetration.
- Quarterly: net margin and EBITDA, pricing and product mix decisions, long-term LTV movement.
Set action triggers ahead of time so you're not debating what a bad number means in the moment. If monthly retention drops more than two percentage points, run a 90-day onboarding audit before you touch marketing spend. If trial-to-member conversion falls below 25%, check lead response time first. Slow follow-up and high no-show rates explain most of the conversion gap between top and bottom performers, and that's usually a faster fix than rewriting your sales script.
Applied Example: Turning Sensor Data Into Retention Signals
A functional-fitness gym running live heart rate tracking and automatic workout scoring generates a behavioral data stream most boxes never see: who's showing up under effort, who's coasting, and who hasn't hit a personal record in six weeks. That last signal often predicts a cancellation before the member ever mentions leaving. Feeding that data into the same dashboard that tracks retention and MRR turns a vague "engagement" feeling into a number you can act on.

A platform built specifically for functional-fitness operators can tie that biometric layer directly to membership and billing data, so a coach sees performance and payment status side by side.
To pilot this in one class:
- Pick a single class time and enable heart rate or performance tracking for that session only.
- Compare attendance and effort scores against your existing check-in data for two weeks.
- Flag any member whose attendance or effort drops before the next billing cycle.
Pro Tip: Run the pilot on your busiest class, not your quietest one. You need enough data points in two weeks to spot a real pattern, not noise.
Fix Retention Before You Chase More Leads
More leads without better retention just means a bigger bucket with the same hole in it. If your monthly churn number is climbing, that's the fire to put out before you spend another dollar on ads. Schedule a standing weekly KPI review, pick one retention-focused experiment, maybe a 90-day onboarding checkpoint call, and run it for a full quarter before you touch acquisition spend again.
— Marcus
How Vo2wod Turns These KPIs Into Daily Decisions
Certain software solutions offer functional-fitness and boutique strength and conditioning operators live behavioral data tied directly to the same system that handles membership and billing. Real-time heart rate tracking and automatic workout scoring capture effort and attendance the moment class ends, no manual entry, no lag between what happened on the floor and what shows up in retention numbers.

That matters most for gyms where community and performance history drive loyalty, since a member who sees their own progress tracked automatically is far less likely to churn quietly. Some platforms pair this with free data migration and a trial period, so switching from a spreadsheet or a legacy platform doesn't cost you a season of clean data. A support team may handle the transition end to end. If you're weighing this against other functional-fitness platforms, the feature comparison breaks down where Vo2wod fits, and the migration details explain exactly what the switch involves. Start by checking your gym's fit for a KPI-driven setup built for how functional-fitness boxes actually run.
Authoritative Benchmark Reports and Analyses
- HFA 2025 Fitness Industry Benchmarking Report — retention and ratio benchmarks
- BizMetricsHQ gym profit margin analysis — net margin data
- Nutripy retention benchmark methodology — measurement notes
- Gym Industry Statistics 2026 — conversion and pricing context
Sources
- 2025 Fitness Industry Benchmarking Report - Health & Fitness Association
- Gym Profit Margin (12–24% Typical) | BizMetricsHQ
- Gym Industry Statistics 2026: 30+ Benchmarks Every Operator Should Know | Gym & Fitness GHL Snapshot
- Gym Retention Rate Benchmarks 2026: The Number, Methodology — Nutripy
FAQ
What are the 5 key performance indicators for a gym?
The five most critical are retention rate, average revenue per member, customer acquisition cost, trial-to-member conversion, and monthly recurring revenue. Together they cover who's staying, what they're worth, what it costs to get them, and how predictable your income is.
What is the 70/30 rule in a gym?
There's no single agreed definition of a "70/30 rule" in the fitness industry, and no benchmarking source in this analysis confirms such a rule. Treat any version you see quoted online with caution unless it's tied to a named, sourced study.
What are the top 3 KPIs to watch first?
Retention rate, monthly recurring revenue, and trial-to-member conversion. Retention tells you if you're keeping members, MRR tells you if income is stable, and conversion tells you if your funnel is actually working before you spend more on leads.
What are some good KPI examples beyond the basics?
Average class attendance, visit frequency, PT and secondary sales attach rate, and CAC payback period all give a fuller operational picture once the core five are under control. A platform like Vo2wod tracks several of these metrics automatically through class booking and biometric data.
How often should I review gym KPIs?
Check lead response time, no-show rate, and class fill rate weekly; review retention, churn, and ARPM monthly; and reassess net margin and pricing decisions quarterly.